



Small Copy Decisions Are Costing Community FIs Real Engagement
Community financial institutions are leaving measurable engagement on the table through copy decisions that are well within their control to change. The findings are consistent across institutions and actionable today.
We run digital marketing campaigns across community banks and credit unions. That accumulates into something most individual institutions don’t have: performance data that cuts across institutions, products, and copy approaches at scale. Not vendor claims. Not benchmarks from a whitepaper. Actual click-through rates on actual ads served to actual members.
We recently pulled several analyses from that dataset. The gap between top-performing and bottom-performing ads at community FIs is rarely explained by audience quality or media spend. It’s explained by copy decisions that are well within any institution’s control to change. That finding kept showing up across every analysis we ran.
CTA language is the highest-impact variable in the dataset
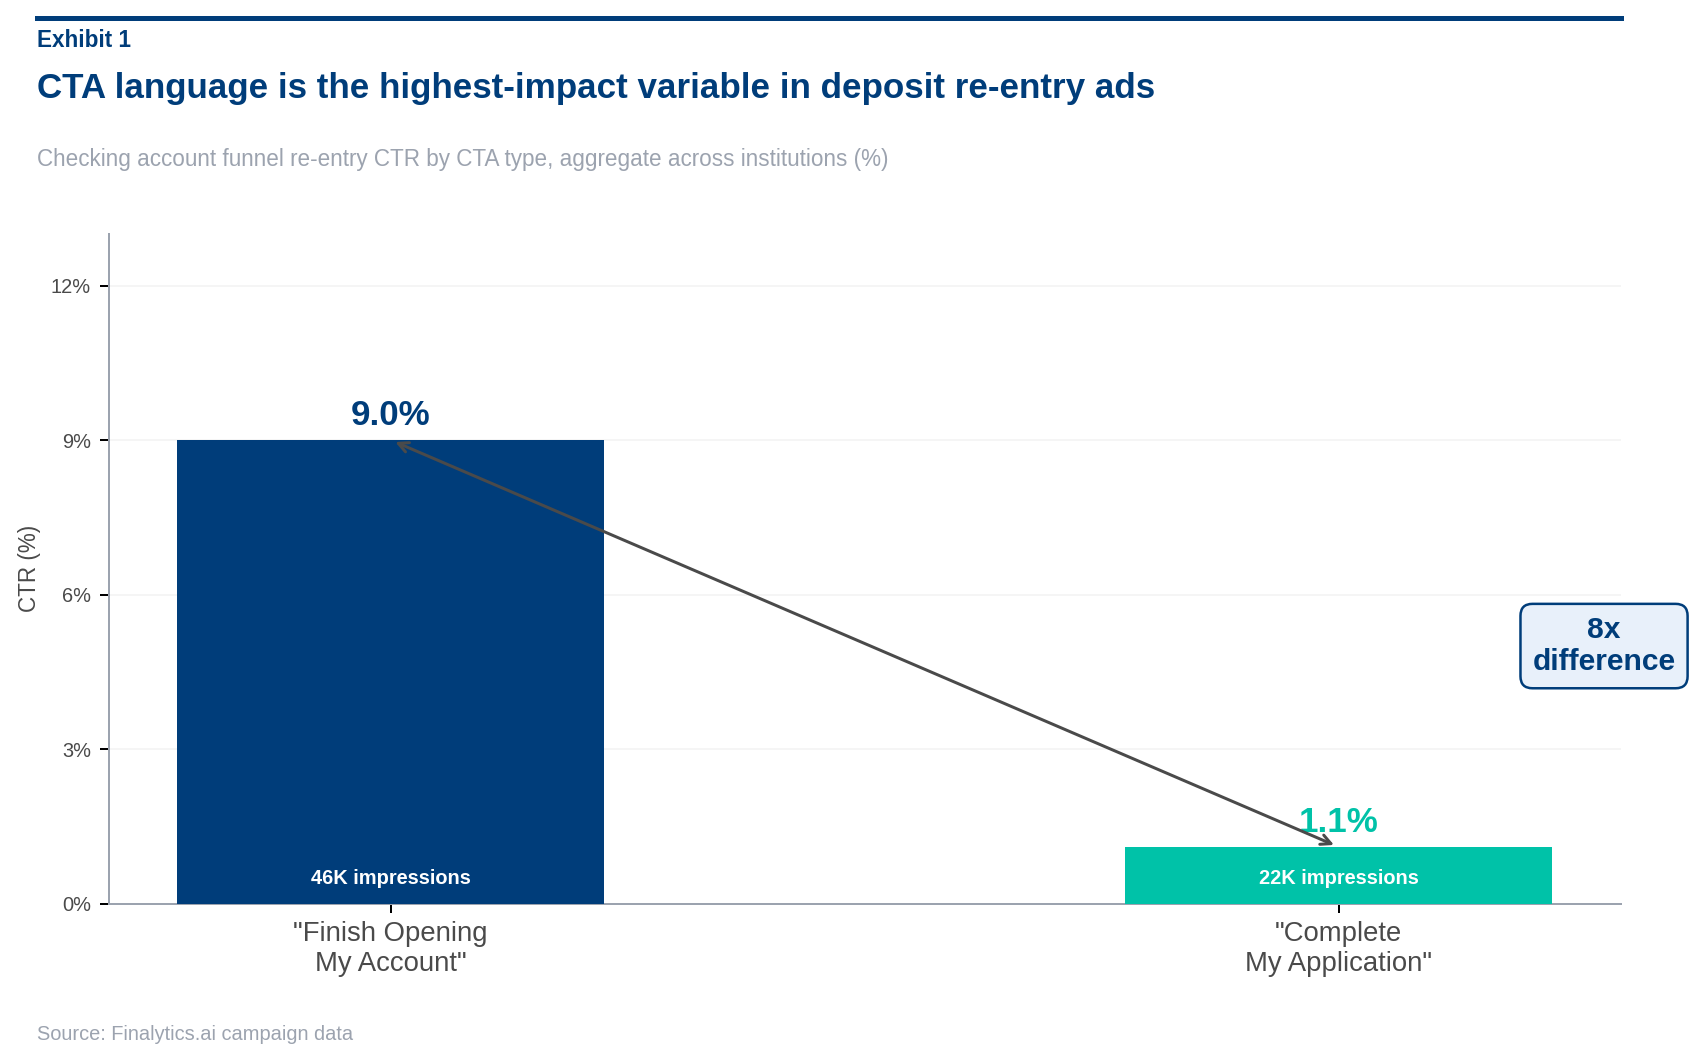
Funnel re-entry campaigns target members who started an account application and didn’t finish. We looked at 77 ads across nine institutions and found a gap that’s hard to overstate.
For deposit products, “Finish Opening My Account” averaged a 9% CTR on checking. “Complete My Application,” used by several of the same institutions on comparable audiences, averaged 1.1%. At one institution, “Complete My Application” generated zero clicks across nearly 19,000 impressions when paired with deposit headlines. The CTA ran. Nobody clicked.
The explanation isn’t complicated. “Finish Opening My Account” mirrors what the member wasdoing: opening an account, not submitting an application. It uses member language rather than institutional process language. That word choice isdoing a lot of measurable work.
Across hero ads, CTA language was the highest-impact variable we measured, with an average CTR spread of 5.4 percentage points across controlled comparisons. Headline came second. Body copy was a distant third.
Capitalization affects CTR in ways that are hard to explain but easy to measure
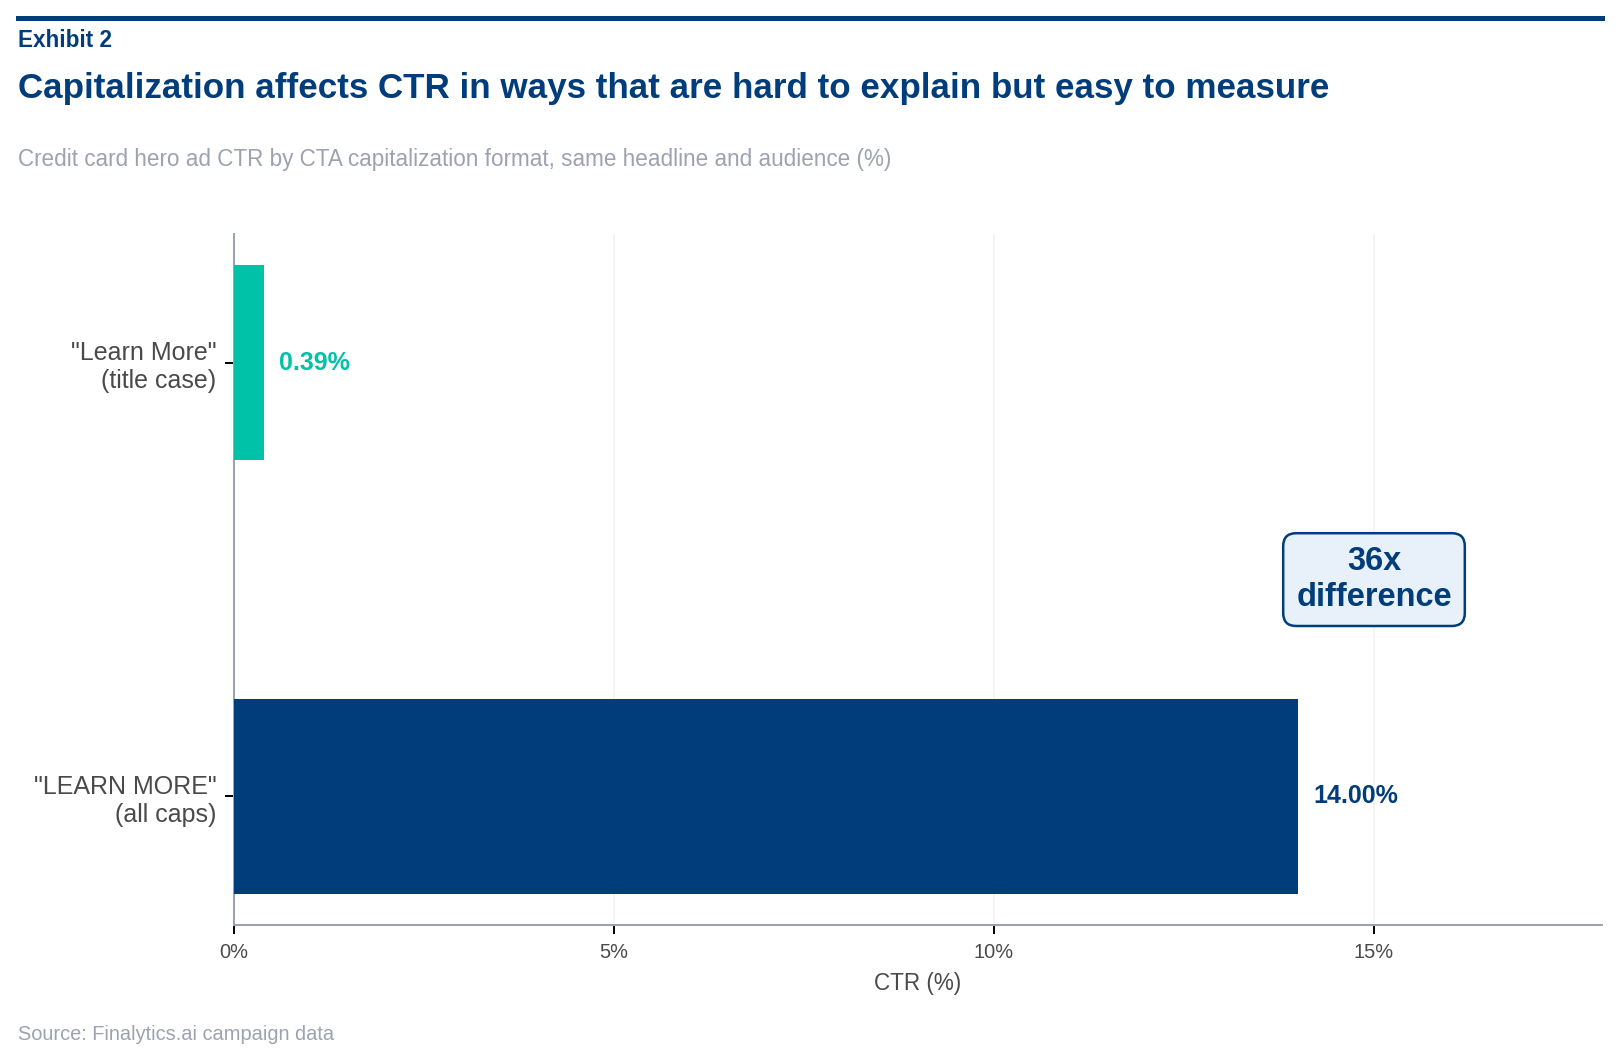
At one institution, two credit card hero ads ran simultaneously: identical headline, identical product, identical audience. The only difference was CTA capitalization.
“LEARN MORE” got a 14% CTR. “Learn More” got 0.39%.
The most natural explanation is visual dominance. The all-caps version read as a more urgent, more visually prominent button. Whatever the mechanism, a 36x difference on a single formatting choice is not noise. Similar patterns appear elsewhere in the data: “APPLY NOW” outperforming “Apply Now” by more than 3 percentage points on mortgage ads; “Complete my application” in sentence case dragging a credit card campaign to 0.2% CTR while every other institution running the same product averaged 4 to 5%.
Community FIs spend significant energy on rate decisions, product design, and brand identity. Button capitalization rarely comes up. The data suggests that’s misallocated attention.
Ads with a specific numerical rate outperform ads without one
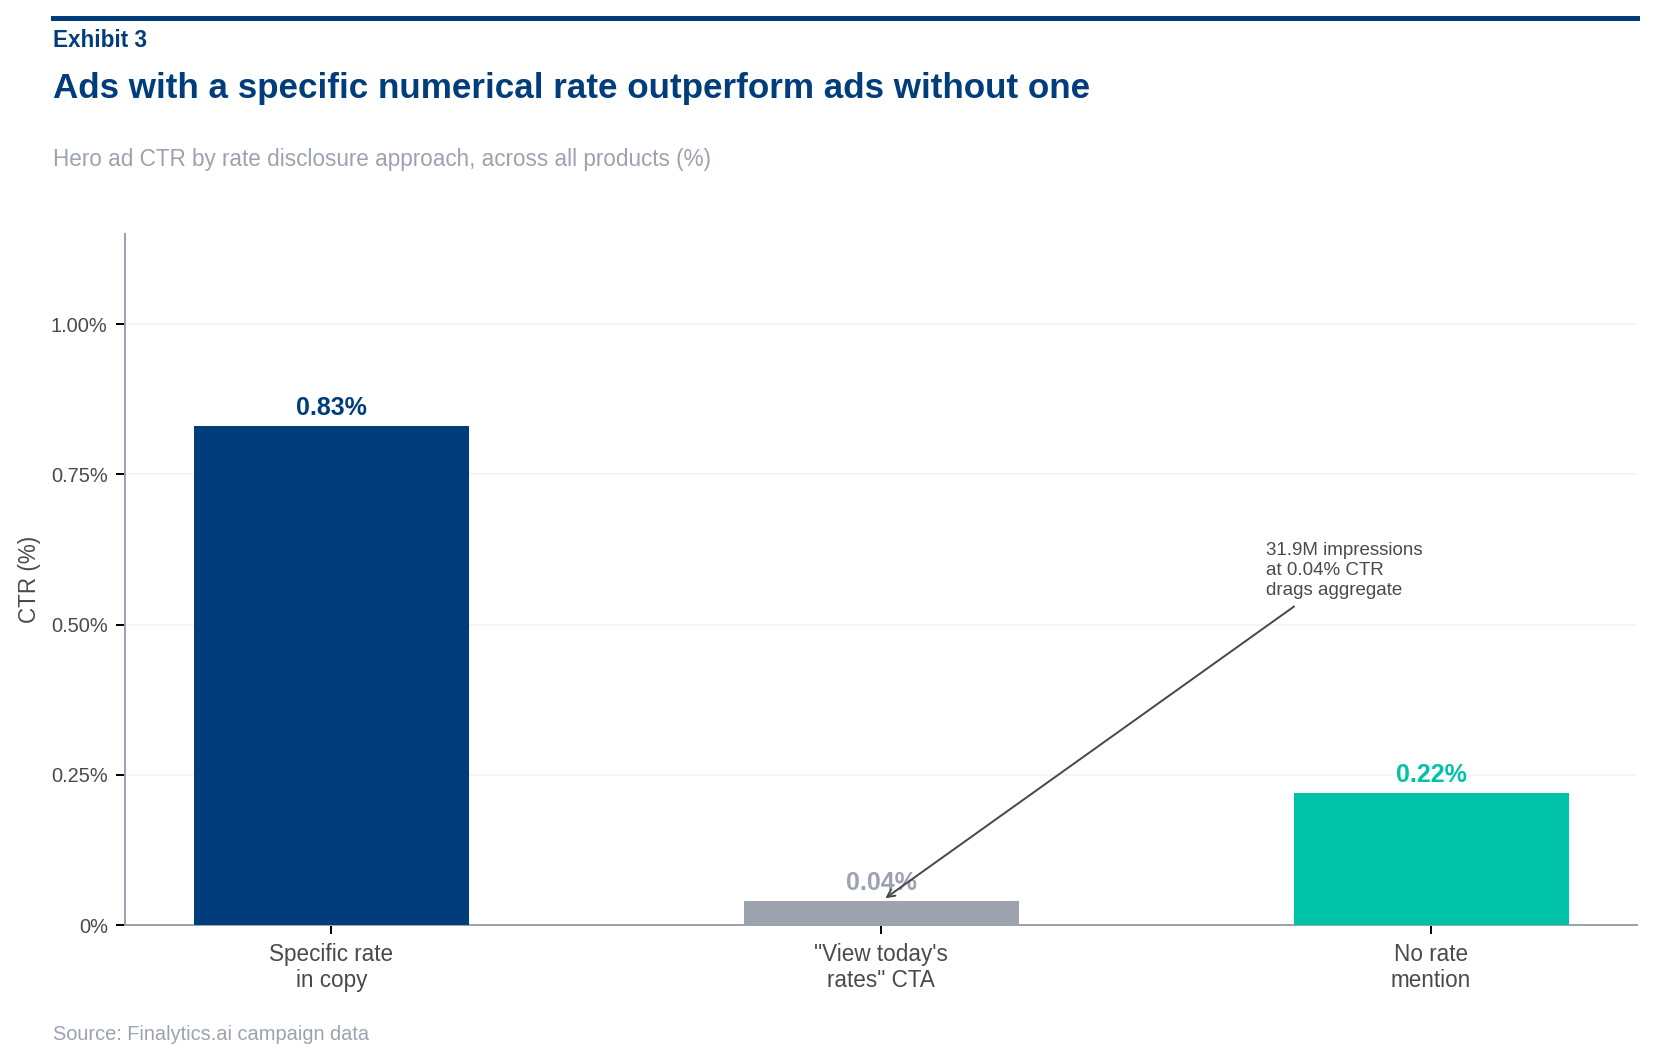
Hero ads that include a specific numerical rate, an APR, APY, or percentage figure somewhere in the copy, outperform ads without one: 0.83% CTR versus 0.22% across the dataset. That’s nearly a 4x difference.
One institution’s data initially obscured this finding. A single high-volume CD ad using “View today’s rates” as a CTA ran 31.9 million impressions at 0.04% CTR, pulling the aggregate for rate-mentioning ads well below where it sits. Isolating that ad clarifies what’s happening: “View today’s rates” asks someone to click in order to be told something they should have been shown in the first place. Rate-forward copy performs when it leads with the number.
The product-level data adds nuance. CDs and savings showed strong positive lift from rate inclusion. Credit cards did not. For loan products, the results were mixed. Rate copy works when rate is the genuine reason a member would act on a given product.
Two CTAs outperform one at the aggregate, but the controlled tests tell a different story
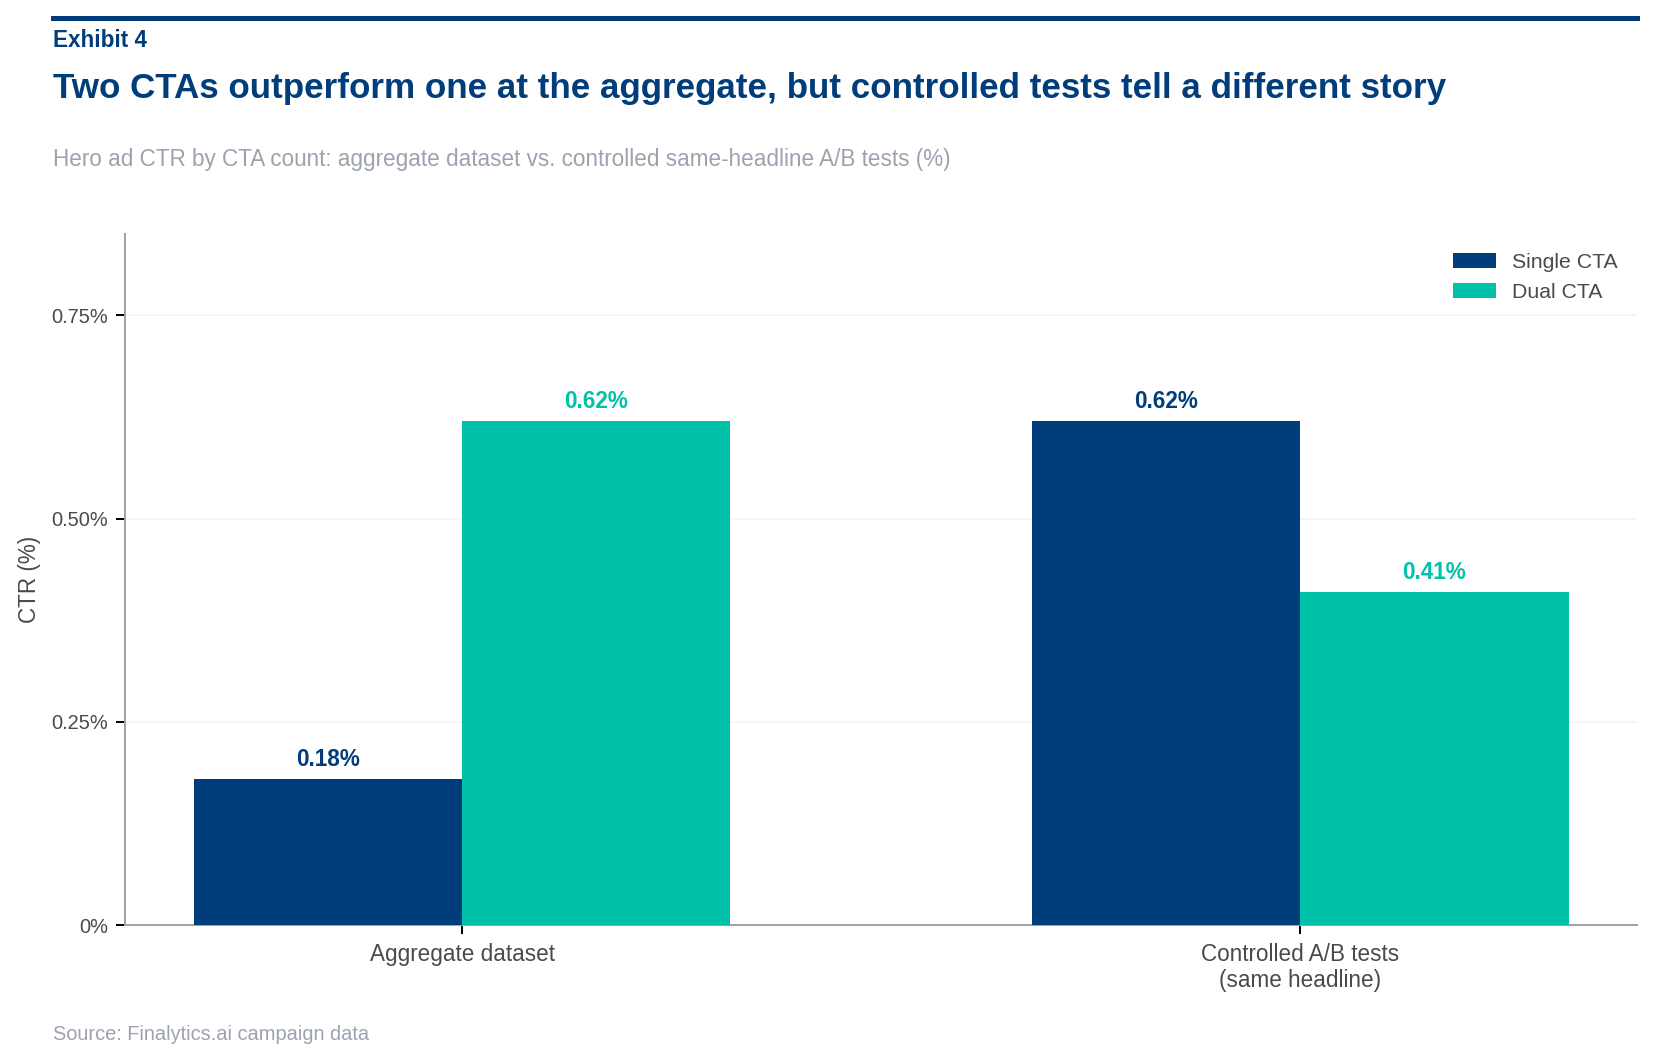
Across the full hero ad dataset, two-CTA ads outperformed single-CTA ads by 0.43 percentage points: 0.62% versus 0.18%. The most effective pairings offered a conversion action alongside a lower-commitment alternative. “Apply Now” with “Calculate Your Payment.” “Open Your High Yield Savings” with “Compare All Savings Options.” The secondary CTA reached members who weren’t ready to convert but were still engaged enough to take a step.
In controlled same-headline A/B comparisons, though, single-CTA ads outperformed dual-CTA in most tests. On mortgage ads across multiple geographic markets, “Apply Now” alone beat “Apply Now” paired with “Learn More” consistently.
The likely explanation: institutions that invest in dual-CTA creative tend to be the same institutions investing more carefully in targeting and headline quality overall. The aggregate lift is real, but a second button does not compensate for a weak primary. When the headline and primary CTA are strong, adding a secondary option can reduce rather than improve overall performance.
The card placement gap is largely a measurement problem
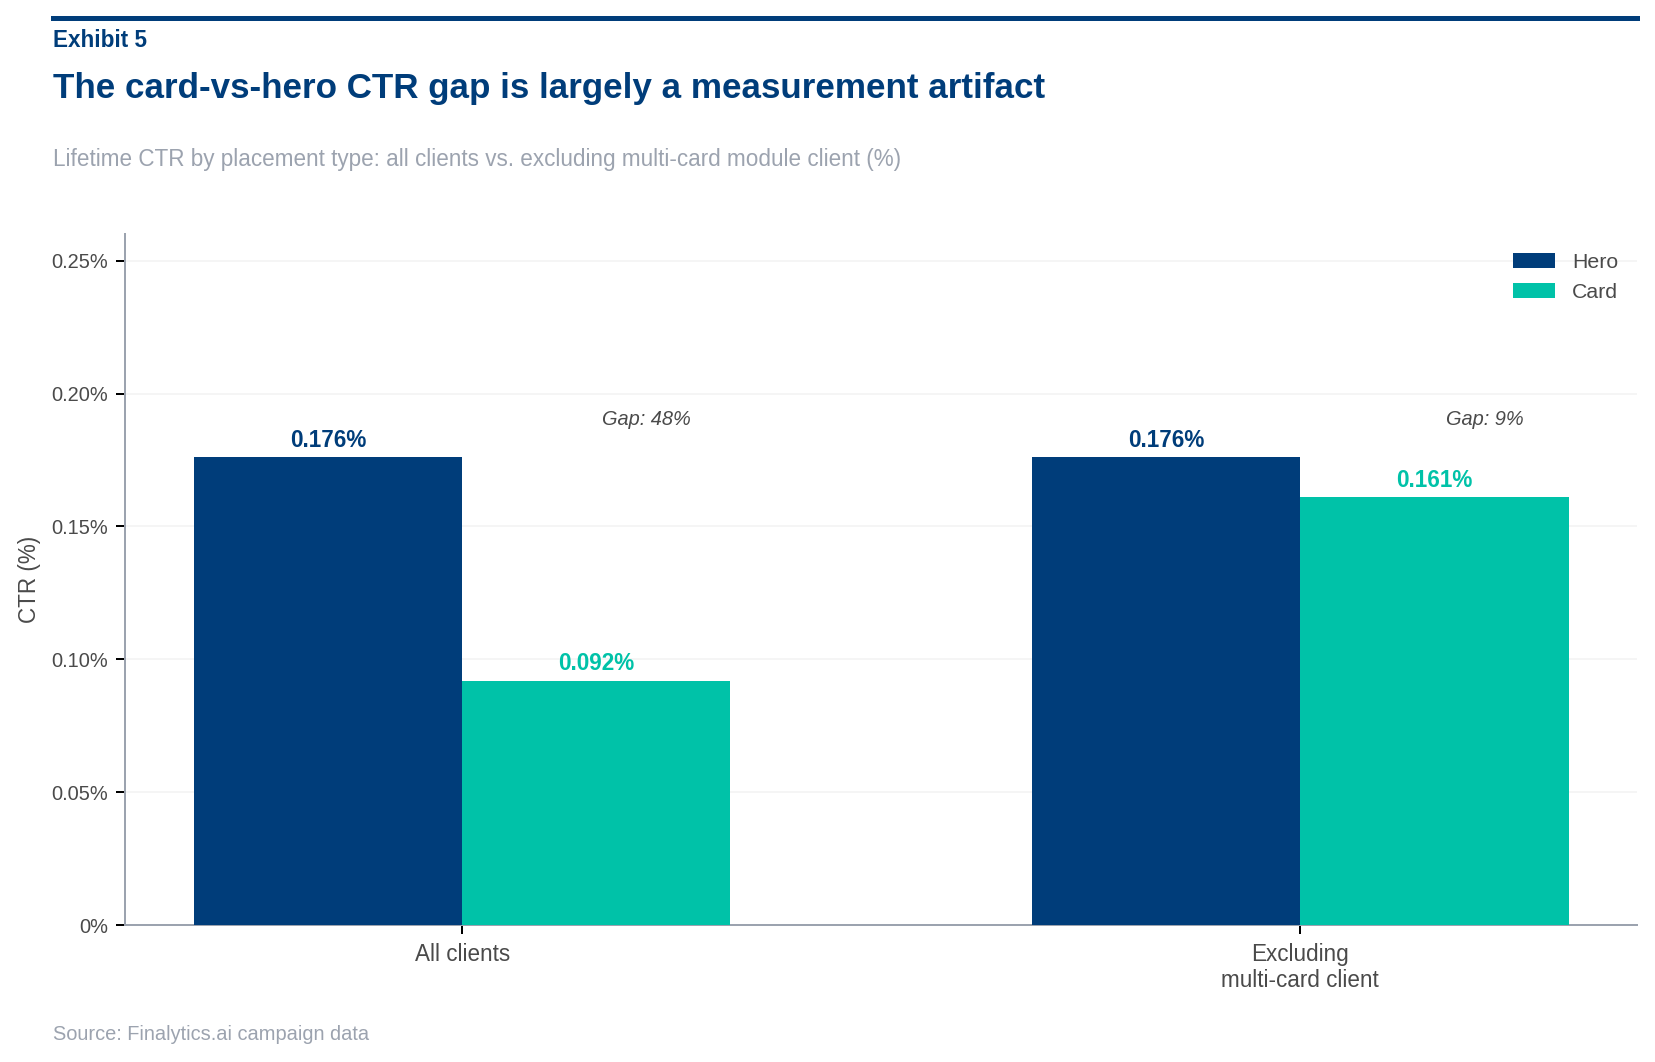
Cards versus hero: the raw numbers show 0.092% lifetime CTR for cards versus 0.176% for hero, roughly a 48% gap. Nearly all of it traces back to one institution running a three-card-per-ad module, three products displayed simultaneously in a single ad unit with three CTAs competing inside one impression. Lower per-ad CTR in that setup is an expected outcome, not a performance problem.
Excluding that client, the gap shrinks to about 9% lifetime. Every remaining institution still shows cards trailing hero slightly, but that reflects placement more than format. Hero ads sit in the primary above-the-fold slot. Card placements typically appear further down the page. Comparing their CTRs directly does not produce a meaningful conclusion about which format works better.
Why we published this
Performance data like this almost never makes it into public view. Vendors protect it as proprietary. Individual institutions don’t have enough volume to draw conclusions from their own campaigns alone. The result is that most community FIs are making copy decisions in the dark, optimizing against intuition rather than evidence.
That’s a solvable problem. The findings here came from aggregating performance across real campaigns at real institutions. The patterns are consistent enough to act on. And the institutions that are already acting on them are measurably outperforming the ones that aren’t.
We publish this because the industry benefits when the evidence is shared. A community bank that improves its funnel re-entry CTR from 1% to 9% retains members it would otherwise have lost. That outcome is good for the institution and good for the members it serves. Keeping the data private doesn’t serve anyone.
Do these findings match what you’re seeing at your institution? We’re particularly curious about the counter-intuitive ones, the copy changes that moved performance in directions nobody expected.